
Your operation isn’t calibrated to demand. It’s calibrated to the demand your own capacity allowed to exist — and that number is what every forecast, every schedule, and every readiness test you run is built on.
The mechanism runs on every operator in the business. The forecast is built from history. The history is the normal load the operation carried. And the normal load is not demand — it’s what was left after the operation’s own constraints turned business away. The cost stays invisible until the one night demand actually arrives: the operation sized to a censored number breaks at the constraint, and the constraint eats the best night’s money. What’s at stake is the gap between the demand you plan against and the demand that’s actually out there — the difference between a station that’s ready and a station that’s ready only on nights that go exactly as planned.
The Industry’s Own Index
The industry-scale version is sitting in the National Restaurant Association’s own data. The September 2026 Restaurant Performance Index printed 100.7 — expansion territory — with its two demand lines pointing in opposite directions: the same-store sales component at 102.3, in expansion, and the customer traffic component at 99.7, in contraction. September was the nineteenth month out of the last twenty in which operators reported a net decline in traffic. The index reads expansion because the sales line is loud and the traffic line is quiet. Sales growth on flat counts is check growth, not demand growth — and four in ten operators expecting higher sales is the industry reading its own pricing and calling it demand.
If the industry’s own index runs the conflation at scale, the single operator’s forecast has no chance by default. The fix starts with naming the three numbers being treated as one.
The Three Demands
Every operator I have ever worked with runs their operation against three different numbers and treats them as one.
Forecasted demand — what you predict tonight will do. Designed demand — what the operation was built to carry. Average demand — what actually shows up, the load you carry every day.
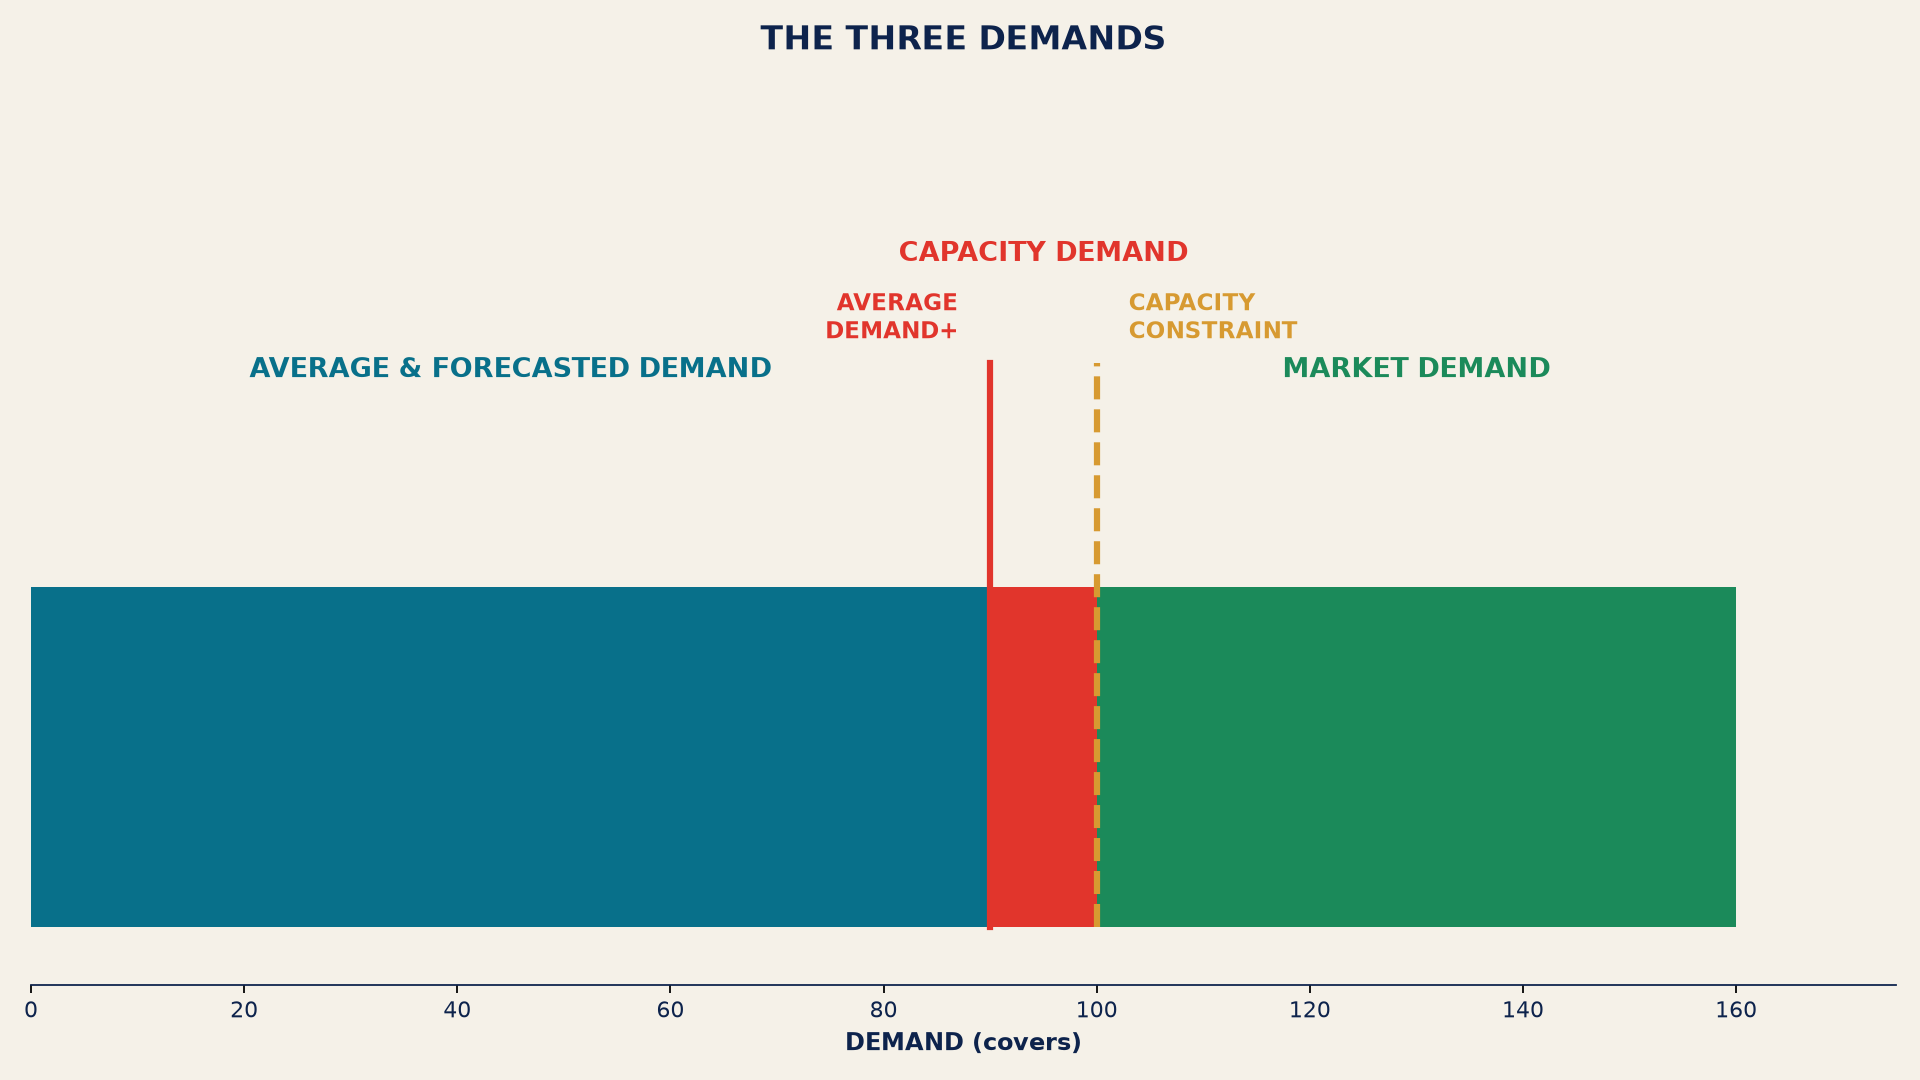
They are not the same number. The forecast is built from the average. The design is built for a peak that never arrives. And the operation calibrates to the average — staffing, prep, muscle memory, all of it tuned to the everyday level. Three numbers treated as one is how a readiness test ends up asking the wrong question: it stress-tests the operation against a baseline that was never the baseline.
The Demand Data Was Censored
Here is the deeper problem: the average is not demand. It’s the demand your own capacity allowed to exist.
The parties you couldn’t seat. The walk-aways. The queue that formed and dissolved. None of that is in your covers count. Your own constraint truncated the data before you ever saw the real number. You have been reading a censored history of your own demand and calling it a forecast.
The station wasn’t sized to demand. It was sized to a version of demand your capacity edited on the way in — and every plan built on that number inherits the edit.
The Break Point Is Average Demand+
A station sized to forecast with no slack breaks at any overage — it was already at the edge at forecast. The buffer is arbitrary because it lets you call the station ready at forecast, and ready at forecast means ready only on nights that go exactly as planned. Those nights don’t exist.
The break point isn’t forecast+20%. It’s average demand+ — that’s what the operation is actually calibrated to carry, and anything above it is where it snaps.
And demand+ is not a hypothetical stress test. The night demand runs hot is the profitable night — the best revenue night you get. If the operation fails first at the constraint, the constraint eats the best night’s money.
The Design Only Exists If It Gets Run
The operation may be designed for peak demand. But if you never hit it, the design defaults to the normal load. Staffing, prep, muscle memory all calibrate to the everyday level. The design only exists if it gets run — so the one night demand actually arrives at capacity, the muscle isn’t there.
That’s Static Decline applied to design: the operation declines to the load it actually carries. A station built for peak and run at 60% of it every night isn’t a peak-capable station anymore. It’s a normal-load station with a peak spec on paper.
There Is Only One Bottleneck
The readiness language — bottleneck here, constraint there — uses the word too liberally. There’s only one bottleneck: the operator.
The station that overloads is a station someone sized. The shift leaning on one person is a schedule someone wrote. The decisions stuck at the manager during the rush are authority someone never delegated. The system is performing exactly as designed — the constraint is always upstream.
The question isn’t where your operation breaks. It’s whether the number you’re testing it against was ever real. First question, before any readiness test: what would demand look like if nothing was turned away?
The Monday Morning Move
For what to do to implement this in your operation, go to The Monday Morning Move.
Digging Deeper
Positions on the record. Restaurant Physics — https://physics.jeffreysummers.com/ — The Monday Morning Move — https://www.fromtheplaybook.com/s/the-monday-morning-move — The Math Library — https://kb.jeffreysummers.com/docs/the-math-library/ — The Operator’s Playbook — https://jeffreysummers.com/the-operators-playbook-overview/
Terms used in this piece. Terms used in this piece: Guest, Static Decline. Definitions in the Knowledge Base.
Discover more from Restaurant Physics
Subscribe to get the latest posts sent to your email.